This week reveals a new surprise in our sharepoint farm: during normal afternoon, somehow some of our pages started to load very slowly, around 30 seconds.
After some investigations:
- only one webapplication was impacted
- only one server was impacted (we have 3 webfrontends)
- seemed that only pages witch our customizations was impacted, regular default.aspx page from site collection was working fine. Layouts page such settings.aspx were ok as well.
- sharepoint stack was working fine (except loading time), customization were failling.
ULS logs were stating with really slow (15 seconds) searchserviceapplicationproxy
`SearchServiceApplicationProxy::GetChannel--Channel Creation time 15.145566`
It was misleading because we changed the search topology the day before, but all refresh generated almost the same lag, ~30 seconds, which was letting us think about a timeout of one of our component.
Our database was running fine, not alert, no extra CPU usage, no extra RAM usage.
Then having a look in our custmization logs, we found these statements
ERROR XXXXXXXXXXXXXXXX:<GetXPathNavigator>b__0 - Web part trying to connect to the database System.InvalidOperationException: Timeout expired. The timeout period elapsed prior to obtaining a connection from the pool. This may have occurred because all pooled connections were in use and max pool size was reached.
Max pool size reached ? really ?
Let's check the number of connections
sp_who with SSMS on your SQL server get you the list of connections

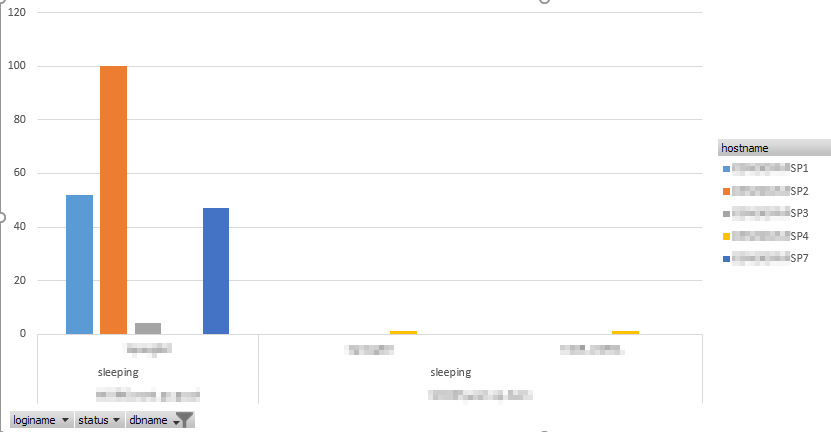
Consolidating in excel helped to have a better overview, playing with pivot.
 Looking at the chart showed clearly that the server SP2 on a specific database (not a sharepoint one) was reaching out the 100 sleeping connections, nothing more, nothing less. Hard to believe to be a coincidence.
Narrowing down the situation, seemed that it's related to a protective system of the SQL adaptor, few google 1 researchs confirmed this ending up with an MSDN reference 2 :
Connections are added to the pool as needed, up to the maximum pool size specified (100 is the default). Connections are released back into the pool when they are closed or disposed.
The most probable rootcause is that our customization aren't releasing correctly the sql connection.
Two 3 ways to address this issue
- improve the sql connection management (effort to be addressed to dev team)
- increase the maxpoolsize in the connection string
- both, increase maxpoolsize on short term + request to improve the sql connection management
tweaking the max connection pool size for the ADO.net adaptor is fairly easy, append max pool size=XXXX in your SQL connection string.