slow ?
Does some of your users complain that sharepoint is slow ? possibly yes.
The rootcause for slow platforms could be numerous
- platform itself (SQL, load, optimization, not well designed customizations)
- related platform activities (eg. incremental backups)
- network between servers
- network between web front ends and load balancer
- internet to client
- wifi ? (we have this situation :))
- client computer/client browser
- etc
but in any case, if end users feel that the platform is slow, they doesn't really care about the root cause and any excuses you might provide about responsability: sharepoint is slow.
before trying to improve or tweaking the system, it's really important to get a baseline in order to check how reacts your platform: what does mean slow ? is it 1 second ? 10 seconds ? is it happening all the time ? is it everywhere ? (yes, a custom page displaying without paging 10K records could be slow, but that's another issue.)
the point is really to be able to narrow down your actions (improving sharepoint platform could be a life time job) and focus your attention on what does really matter. Following Microsoft best practises on SQL IO rate for gaining 20milliseconds might be overkill when one of your custom developments have been poorly design, such looping over a large number of sharepoint spsite/spweb.
end user loading time ?
Sharepoint provides per default a set of report & queries for knowing the load & time for pages. But does it really matter (yes it can help to address some specific page issue) ? especially now that the majority of pages are loading with a bunch of asynchronious parts which prevents to have a clear understanding of how much time my user waited to start interaction with the content (content can continue to load in the background).
why not using google analytics for that purpose ?
you will know (or at least estimate) how directly your end user load the site by using Avg Page Load Time data 1
Avg. Page Load Time consists of two components:
1) network and server time, and
2) browser time. The Technicalsection of the Explorer tab provides details about the network and server metrics. The remaining time is the browser overhead for parsing and executing the JavaScript and rendering the page.)
per default, only 1% of all records are gathered, but you can increase this value by setting up the sampleRate in your google analytics javascript call in your masterpage
ga('create', 'UA-XXXXXXXX', {'siteSpeedSampleRate':100});
after a while (directly in google analytics UI, you might wait max for 24 hours), you should get data regarding the load speed.
Behavior > Site Speed > Overview

(what a nice peak with 50 seconds ...)
for now, these data aren't so practical, the refresh rate is every 24 hours (you might want some "live" monitoring) and you the export function isn't so cool and not enough granular (only hours).
But google analytics provides of course an API and a really nice Query Explorer 2 where site speed figure are available. By adding some extra dimension, you can easily create a nice export with accurate timespan : minute granularity.
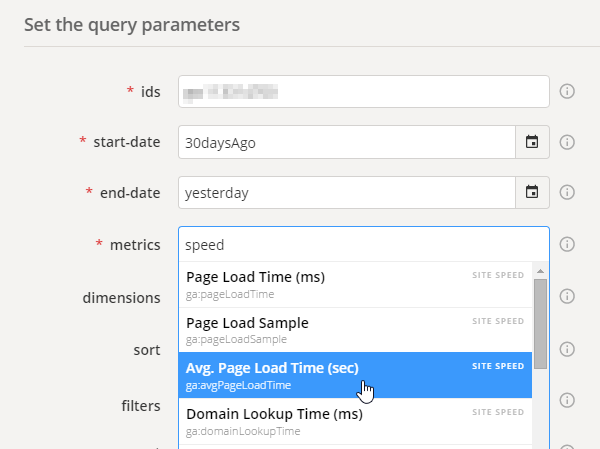
Nice if we want to export it in excel & play with it
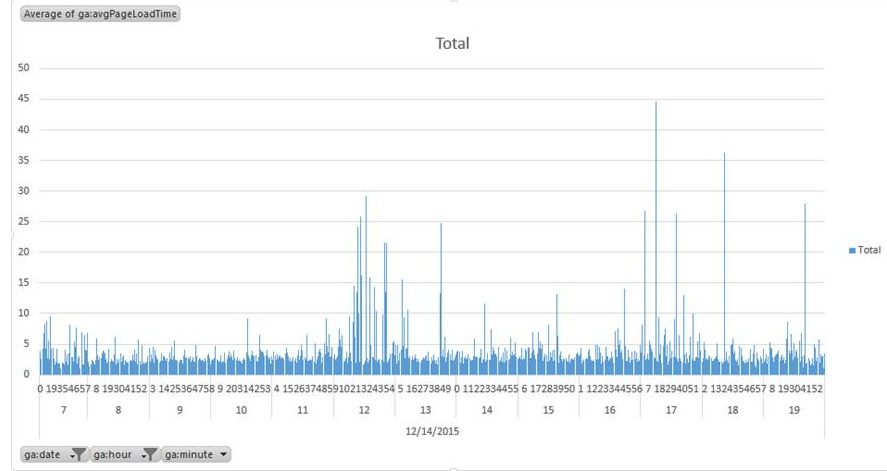 But could we do better ? why not trying to use some cool tool such ...
Power BI
I used (and still do when no choices) to lookup for data (only 1 or 2 usage, or investigation), export in CSV or whatever, import on Excel, chart it and ... the next time I restart the operation from 0.
But this time, I have source data (google analytics) which are easily reachable from outside, so let's check Power BI

cool there is a connector for google analytics (you will have to allow "Power BI" to reach your google account)
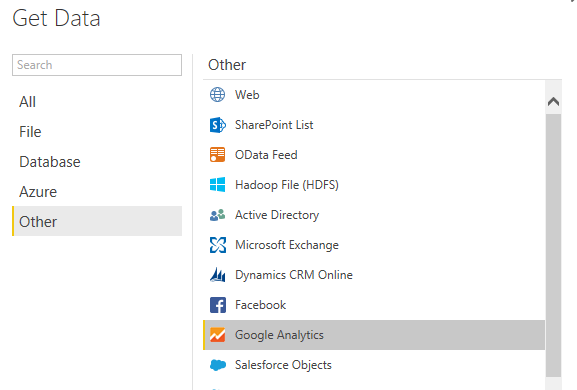
All your dimensions are there
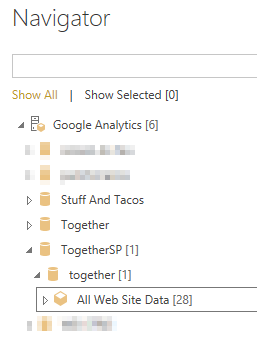
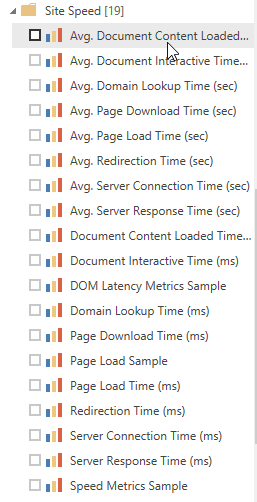
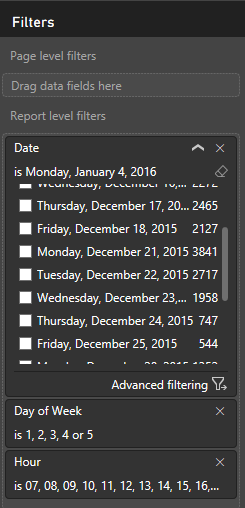
Let's grab a few dimension, in my case. No consolidated datetime field exists. I've added day of week information in order to be able to report on our SLA (Service Level Agreement) : Monday to Friday, 7AM to 7PM (preventing to have false positive values like while deployment)
- Avg. Page Load Time (sec)
- Date
- Day of Week
- Hour
- Minute
- Country
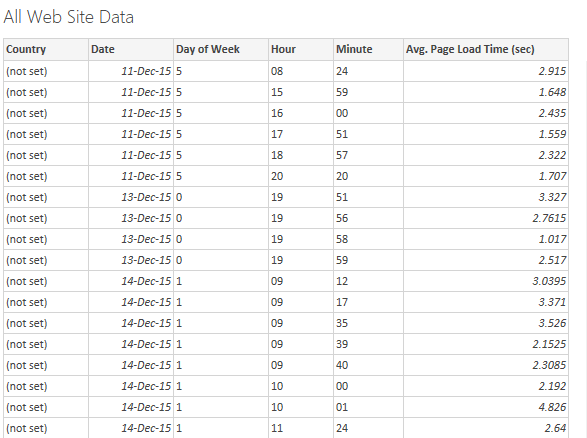
When the model is loaded, we have to generate a date from field date, hour & minute to be able to graph it. Right click on All Web Site Data and new column, let's call it ConsolidatedDate.
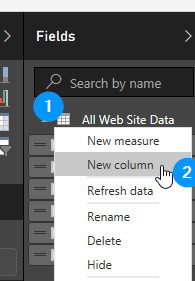 Edit the column formula :
ConsolidatedDate = [Date] + TIME([Hour],[Minute],0)
then it's easy as hell to chart what we want, be careful, per default the Value is the sum. In our case we want the average of the average (ouf) for a specific timespan.
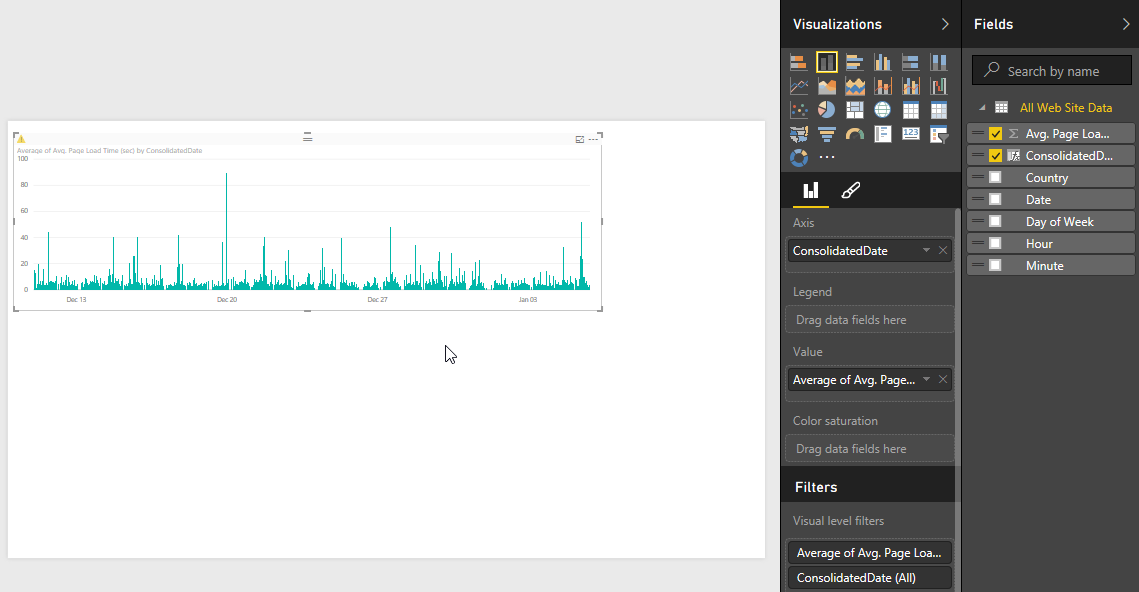
It's even simple to display only SLA (we could have done that before in the model filtering)
We can even simply by using the "country" field display where we had load issue and determine if it's related to a remote connection or not (not in our case)
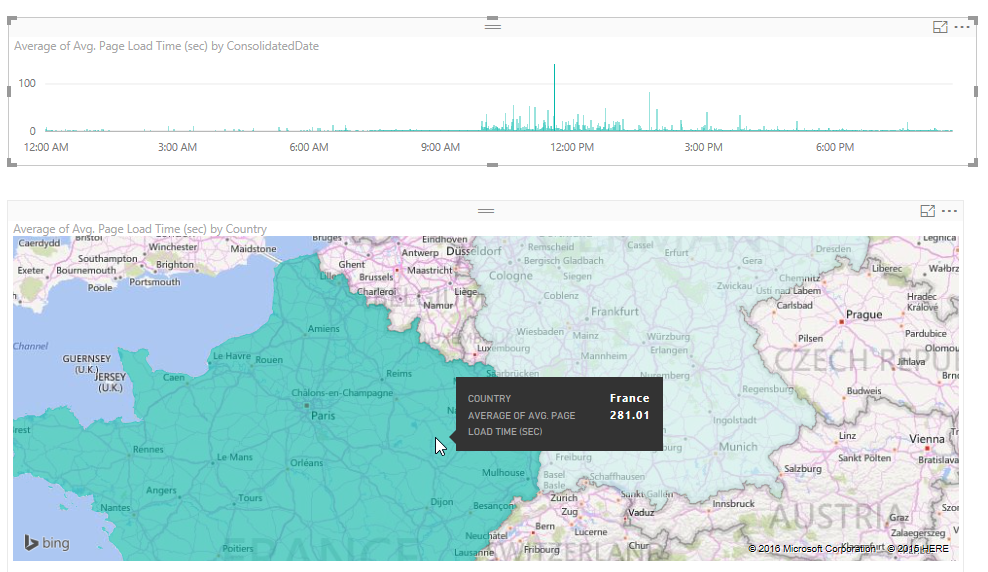
In our case, we are only monitoring our homepage because we are sure at 90% that it has trouble. But these charts (especially if you include page URI in field from google analytics) might definitively help to understand what's going on, which scope is impacted.
And you might even be able to draw "live" dashboard or create alerts with these data.